Examples and calculation details for each budget section are included below.
- Planned Staffing
- Project Budgets
- Other SNAP-Ed Expenditures
- Non-SNAP-Ed Funding
- Travel
- Indirect Costs
- Estimated Unobligated Balance
- Total Budget
The data shown in this example are designed to represent the calculations performed within the site and do not represent actual SNAP-Ed budget data.
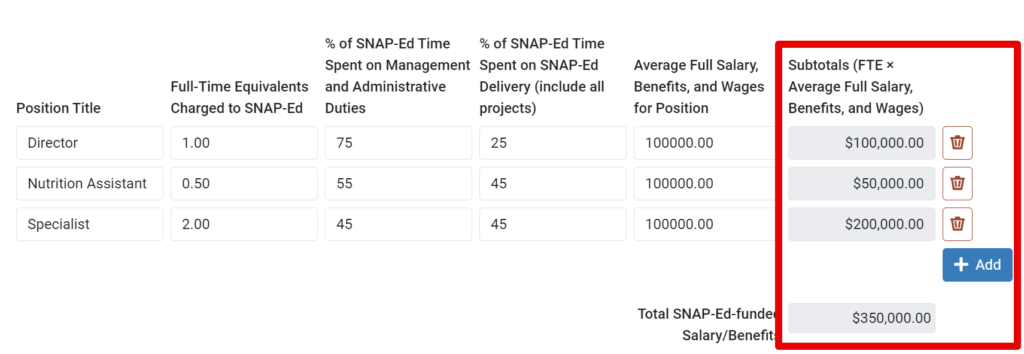
Planned Staffing
Total Staffing Budget is auto-summed to show the total SNAP-Ed Salary, Benefits, and Wages for all positions. Note that each SNAP-Ed Salary is multiplied by the Full-Time Equivalents Charged to SNAP-Ed.
EXAMPLE: Total Staffing Budget
$100,000 x (1.00) + $100,000 x (0.50) + $100,000 x (2.00) = $350,000.00
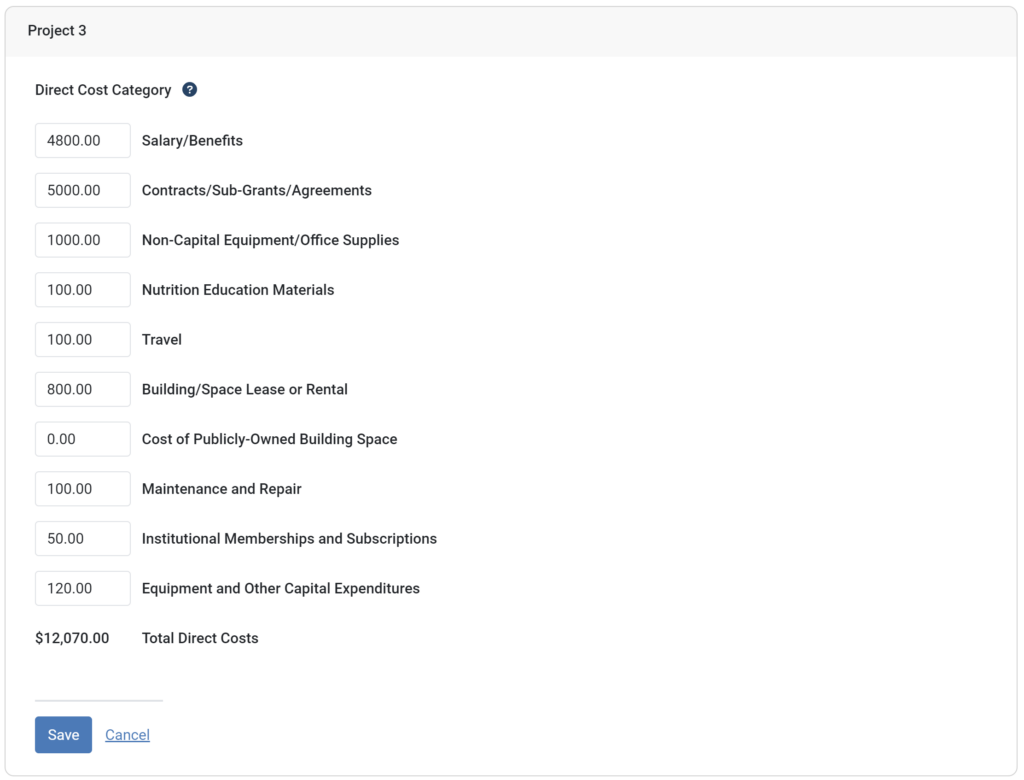
Project Budgets
One project budget is automatically created for each project listed in module 3.
Total Direct Costs for each project are auto-summed for each project.
EXAMPLE: Project 3 Total
4,800 + 5,000 + 1,000 + 100 + 100 + 800 + 0 + 100 + 50 + 120 = 12,070
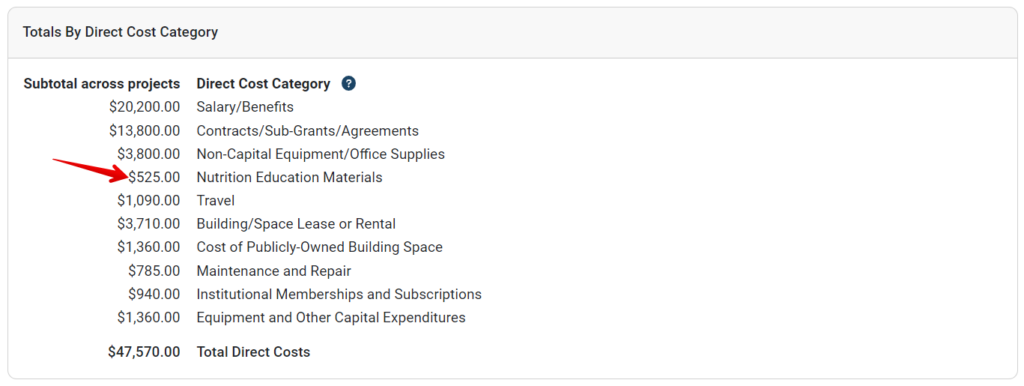
Subtotals Across Projects for each Direct Cost Category are auto-summed at the bottom of the page.
EXAMPLE: Nutrition Education Materials Total
65 + 360 + 100 = 525
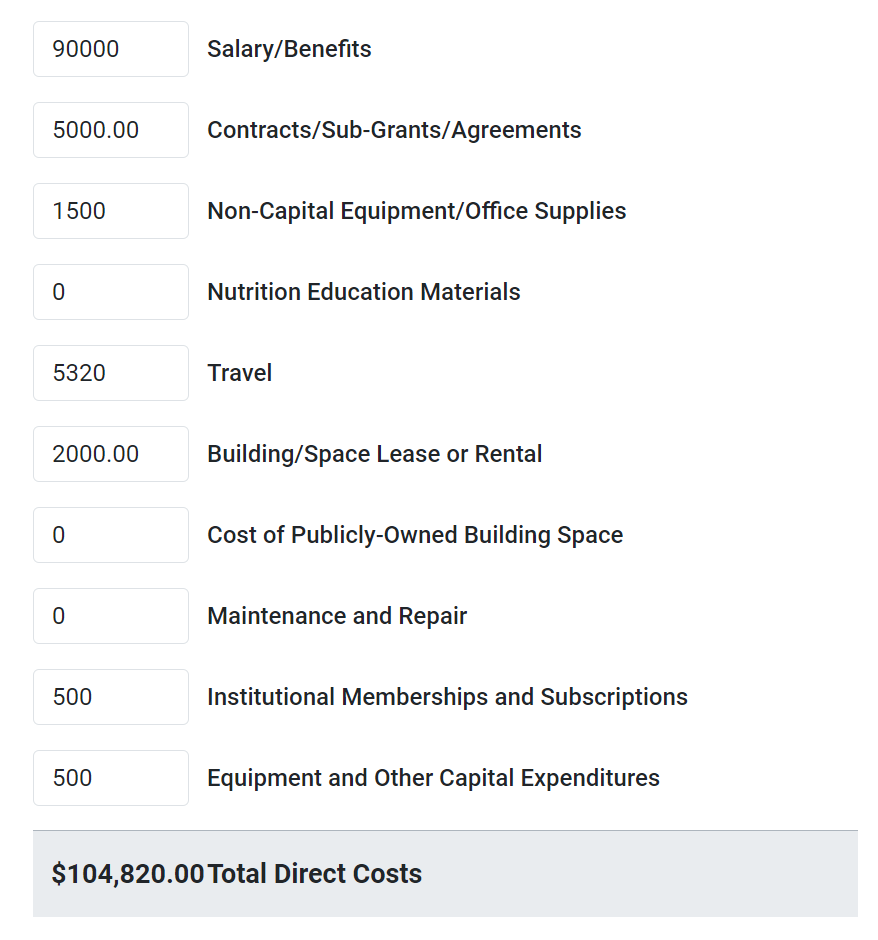
Other SNAP-Ed Expenditures
Direct Costs from each category are auto-summed to show the total Planned Budget for Other SNAP-Ed Activities.
EXAMPLE
90,000 + 5,000 + 1,500 + 0 + 5,320 + 2,000 + 0 + 0 + 500 + 500 = 104, 820
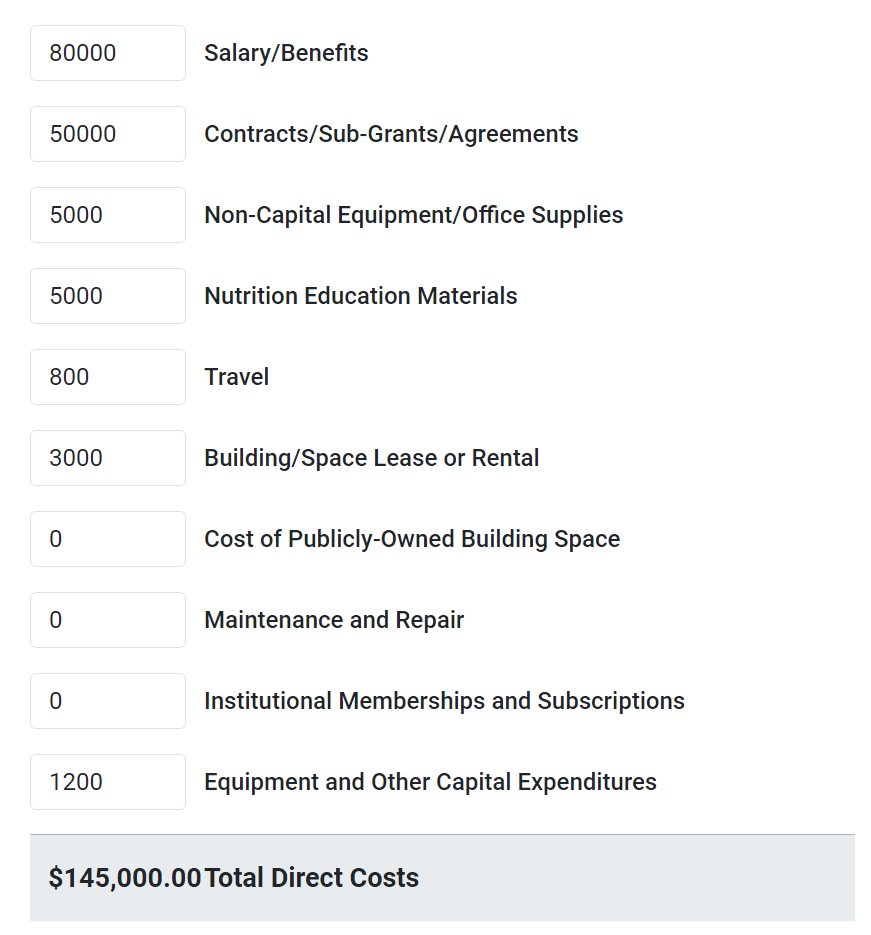
Non-SNAP-Ed Funding
Direct Costs from each category are auto-summed to show the total “Other (i.e., Non-SNAP-Ed) Planned Public and Private Funding”
EXAMPLE
80,000 + 50,000 + 5,000 + 5,000 + 800 + 3,000 + 0 + 0 + 0 + 1,200 = 145,000
Travel
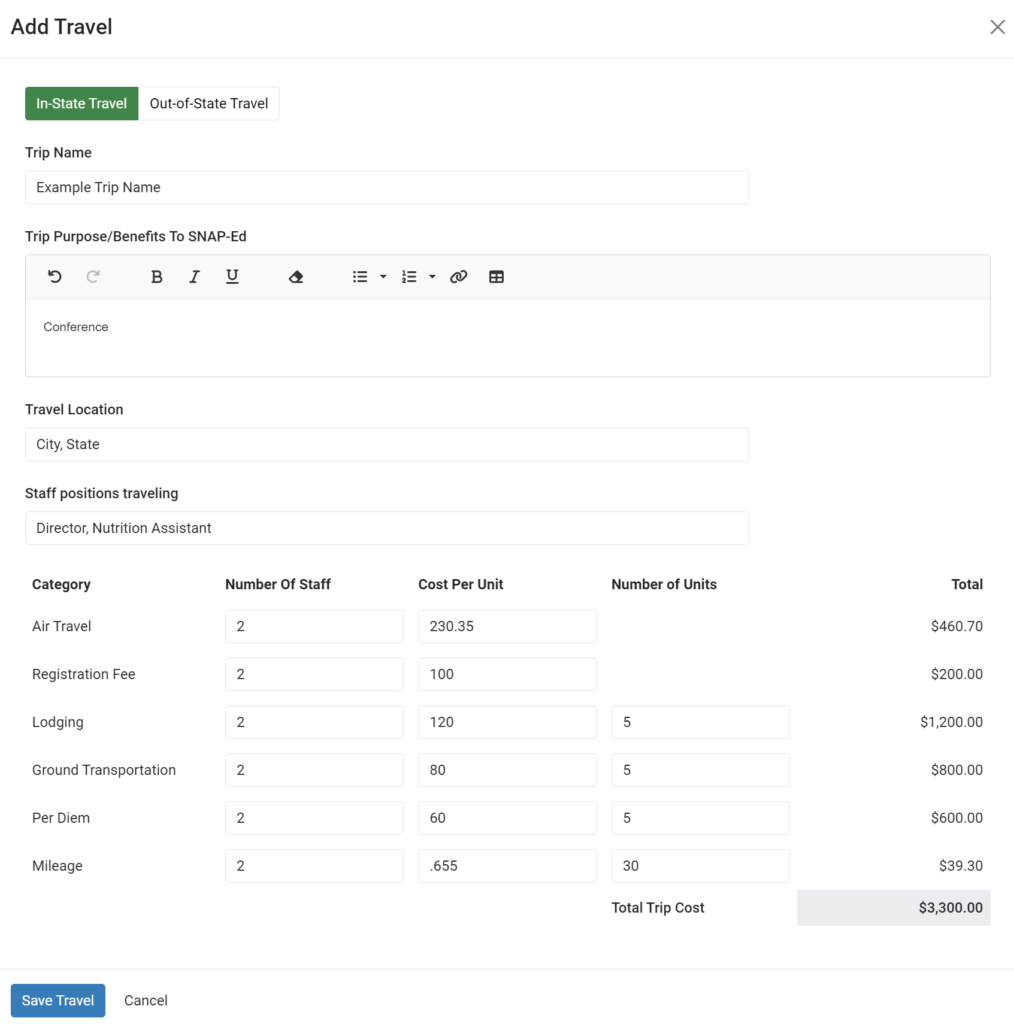
Click Add Travel to add data for an individual trip.
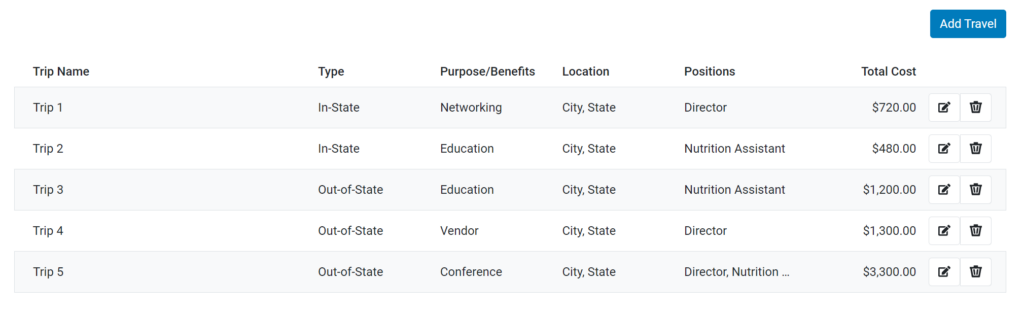
Data listed in each row are automatically multiplied to show the total cost for each category.
EXAMPLE: Trip Lodging Total
2 x 120 x 5 = 1,200
Totals for each cost category are automatically summed to show the total trip cost.
EXAMPLE: Trip Total Cost
460.70 + 200 + 1,200 + 800 + 600 + 39.3 = 3,300
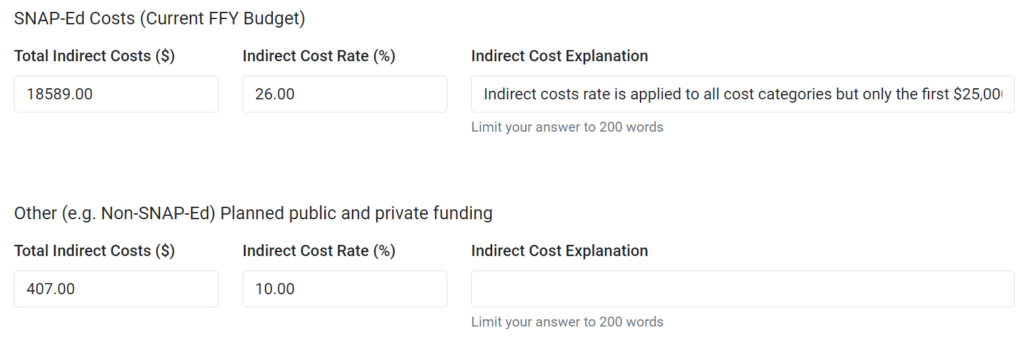
Indirect Costs
- This data is not auto-filled. Users manually enter the Total Indirect Costs, the Indirect Cost Rate, and/or Indirect Cost Explanation, if there is no single indirect cost rate percentage.
- To describe the indirect cost rate users may enter an Indirect Cost Rate (%), Indirect Cost Explanation, or both.
- It is the user’s responsibility to make sure the Total Indirect Costs and the Indirect Cost Rate match up accurately, if needed. The system does not validate the indirect costs entered against the total budget.
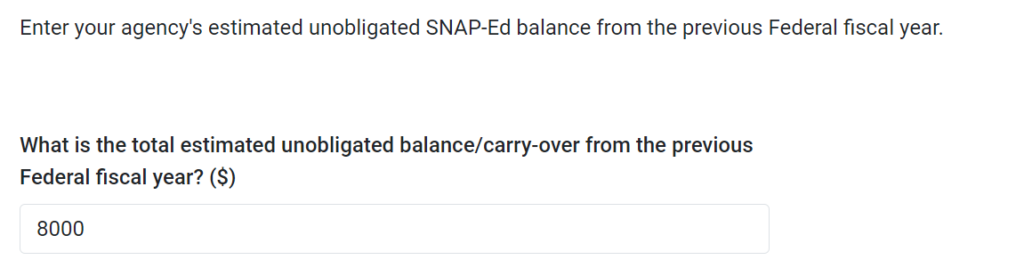
Estimated Unobligated Balance
This section does not include calculations.
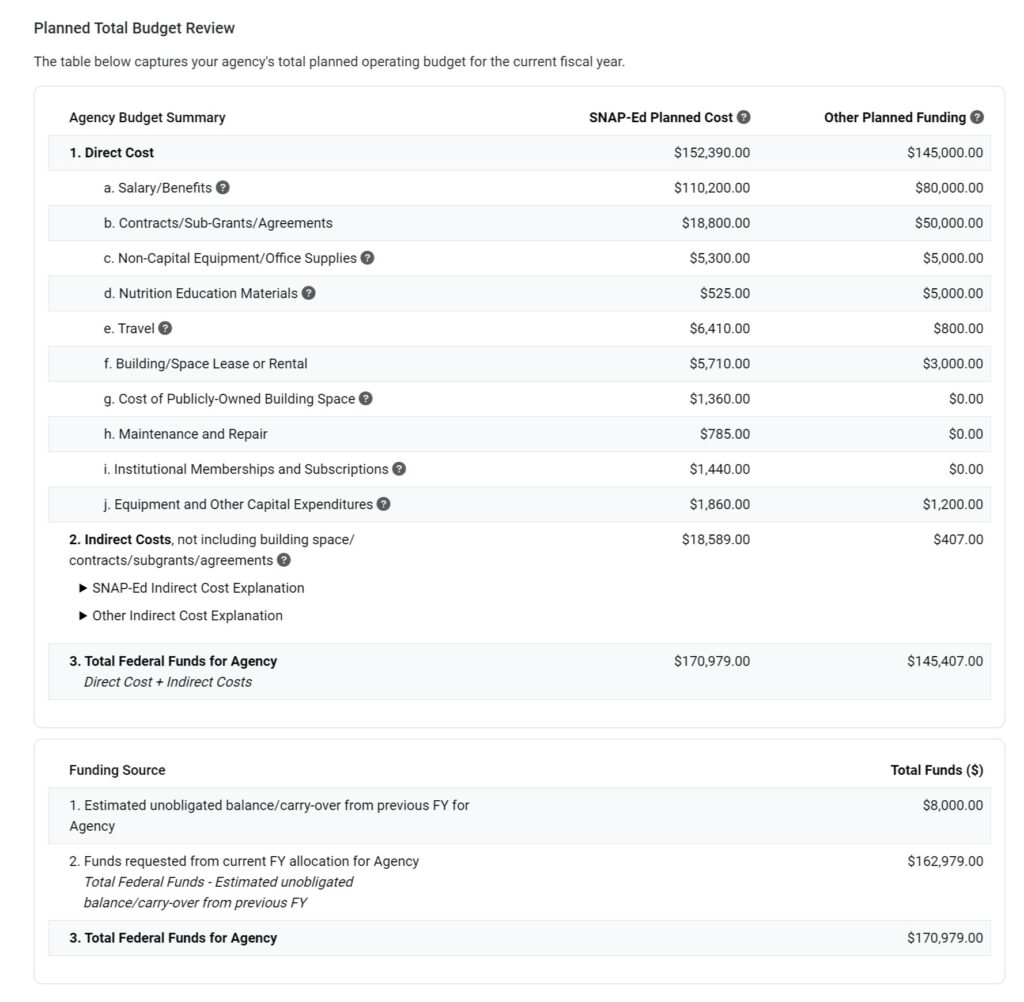
Total Budget
The Total Budget table is read only. Data from the budget module are automatically pulled in to calculate the Total Budget for the year.
- For Implementing Agency (IA) plans, the Total Budget page reflects budget data entered for that IA.
- For State Agency (SA) plans, the Total Budget page includes budget data entered for the SA and budget data entered for all IAs in the state. On the SA total budget page, the IA budget totals are included in the Contracts/Sub-Grants/Agreements total.
Total Direct Costs = Sum of all Direct Cost Category Totals
EXAMPLE: Total Direct Costs
110,200 + 18,800 + 5,300 + 525 + 6,410 + 5,710 + 1,360 + 785 + 1,440 + 1,860 = $152,390
Total for each Direct Cost category = Total cost across all projects + Total cost for Other SNAP-Ed Expenditures
Total Salary/Benefits = Salary/Benefits total across all projects + Salary/Benefits total for Other SNAP-Ed Expenditures
EXAMPLE: Total Salary/Benefits
20,200 + 90,000 = $110,200
Indirect Cost data is auto-filled from the total on the Indirect Costs page.
EXAMPLE: Total Planned Indirect Costs for SNAP-Ed
$18,589
- Total Federal Funds = Total Direct Cost + Total Indirect Cost
EXAMPLE: Total Federal Funds
152,390 + 18,589 = $170,979
- Estimated unobligated balance/carry-over data is auto-filled from the total on the Carry Over Balance FFY page.
Funds requested from current FFY allocation = Total Federal Funds – Carry-over
EXAMPLE: Funds requested from current FFY allocation
170,979 - 8,000 = $162,979