Overview
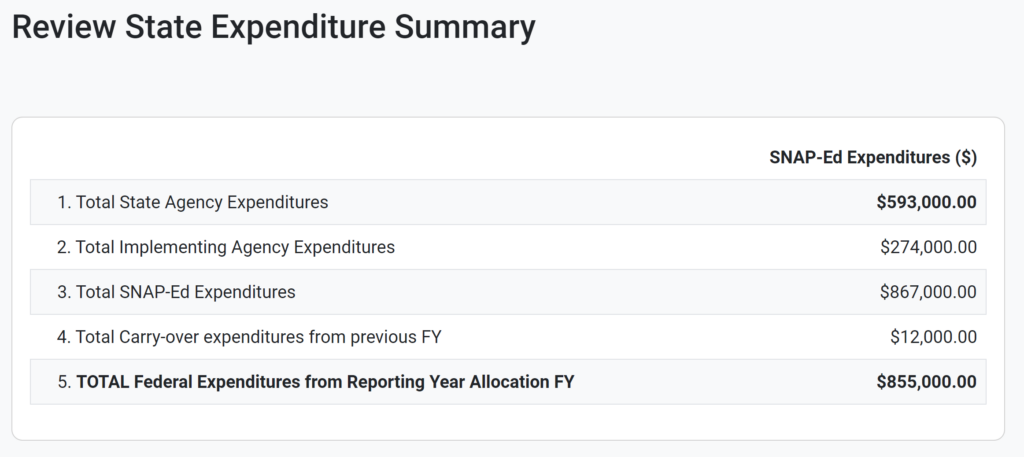
In the Final Review, State agencies and Regional Offices have access to a “State Expenditure Summary” section. The State Expenditure Summary shows reported implementing agency expenditures and a summary of expenditures for the State as a whole.
The State Expenditure Summary table is read only. Data reported in the SNAP-Ed Financial Reporting module in implementing agency reports and the State agency report are automatically pulled into the State Expenditure Summary section to calculate the State’s total federal expenditures from reporting year allocation FY.
More details on the calculations for each expenditure are included below:
Example

1. Total State Agency Expenditures
- The “Total State Agency Expenditures” line item represents the total expenditures for the State agency. This shows the State agency’s total direct costs and indirect costs for the fiscal year.
- This data is pulled from “TOTAL Agency Expenditures from Reporting Year Allocation” line item in the SNAP-Ed Financial Reporting module for the State agency report.
2. Total Implementing Agency Expenditures
- The “Total Implementing Agency Expenditures” line item represents the total expenditures for all implementing agencies in the State. This represents all implementing agencies’ total direct costs and indirect costs for the fiscal year.
- This data is the sum of “TOTAL Agency Expenditures from Reporting Year Allocation” line items from the SNAP-Ed Financial Reporting module in all implementing agency reports.
3. Total SNAP-Ed Expenditures
The “Total SNAP-Ed Expenditures” line item is the sum of Line 1. Total State Agency Expenditures and Line 2. Total Implementing Agency Expenditures, representing the total expenditures for all agencies in the State (both the State agency and all implementing agencies).
EXAMPLE: Total SNAP-Ed Expenditures = $867,000
Total State agency SNAP-Ed Expenditures = $593,000
Total Implementing agency SNAP-Ed Expenditures = $274,000
Total SNAP-Ed Expenditures = $593,000 + $274,000
Total State agency SNAP-Ed Expenditures = $593,000
Total Implementing agency SNAP-Ed Expenditures = $274,000
Total SNAP-Ed Expenditures = $593,000 + $274,000
4. Total Carry-over expenditures from previous FY
The “Total Carry-over Expenditures from the Previous FY” line item represents the total carry-over expenditures for the State agency and all implementing agencies.
This line item is the sum of the “carry-over from the previous Federal fiscal year” numbers reported in the Carry-over Expenditures section in the SNAP-Ed Financial Reporting module of the State agency and implementing agency reports.
EXAMPLE: Total Carry-over expenditures from previous FY = $12,000
Total State agency Carry-over Expenditures from previous FY = $10,000
Total Implementing agency Carry-over Expenditures from Previous FY = $12,000
Total Carry-over expenditures from previous FY = $10,000 + $2,000
Total State agency Carry-over Expenditures from previous FY = $10,000
Total Implementing agency Carry-over Expenditures from Previous FY = $12,000
Total Carry-over expenditures from previous FY = $10,000 + $2,000
5. TOTAL Federal Expenditures from Reporting Year Allocation FY
- The “TOTAL Federal Expenditures from Reporting Year Allocation FY” line item represents the total SNAP-Ed expenditures (for the State agency and all implementing agencies) minus the total carry-over expenditures (for the State agency and all implementing agencies).
- This line item is equal to Line 3. Total SNAP-Ed Expenditures minus Line 4. Total Carry-over Expenditures from Previous FY.
- This represents the total federal expenditures from the reporting year allocation FY.
EXAMPLE: TOTAL Federal Expenditures from Reporting Year Allocation FY = $855,000
Total SNAP-Ed Expenditures = $867,000
Total Carry-over Expenditures from Previous FY = $12,000
TOTAL Federal Expenditures from Reporting Year Allocation FY = $867,000 - $12,000
Total SNAP-Ed Expenditures = $867,000
Total Carry-over Expenditures from Previous FY = $12,000
TOTAL Federal Expenditures from Reporting Year Allocation FY = $867,000 - $12,000